
Photo: Firefighters battle a blaze near Pekanbaru, Riau in 2019. These wildfires, initiated by humans, quickly become out of control in the region, burning for months on end with devastating consequences. Source: Wahyudi/AFP/Getty Images [1].
Clara Bayley is Leverhulme Wildfires summer placement student. She has recently completed her undergraduate degree in Natural Sciences at the University of Cambridge, and is now studying for a MSci in Physics. Here, Clara reports on the work that she carried out during her eight-week placement, working with Dr Matt Kasoar, in the Department of Physics at Imperial.
Every year people initiate vast wildfires across Indonesia, burning millions of acres of peatlands and forests in just a few months. In doing so, they release millions of tons of toxic gases which spread out into a thick haze hundreds of kilometres across, poisoning millions of people [2]. The annual burning of peatlands releases a tonnage of carbon dioxide which easily doubles Indonesia’s greenhouse-gas emissions. As a result, Indonesia is the fourth largest emitter in the world [3]. The implications for global warming are obvious and indisputable but impact on the regional climate may be considerably more dramatic than scientists have previously realised.
Recent research has shown that the most devastating of these wildfires in history have all occurred during the peak of extremely large El Niño oscillations. This is no co-incidence. The warming across the Pacific in El Niño years drags the rain eastwards, inducing drought across South-East Asia. With less than 4mm/day of precipitation, the Indonesian wildfires show a non-linear sensitivity, expanding wildly with catastrophic consequences [4]. The record-breaking wildfires of 2015 demonstrate the scale of the problem. 2.6 million hectares of peatlands and forest burned in just 5 months, that’s an area equivalent to 10% of the UK [5]. At the peak in October, daily CO2 emissions from the fires alone exceeded those from the entire US economy – more than 16 million tons of CO2 was released per day. The long term trend in land-use change is making the region more sensitive to drought-induced fire. Without substantial reform, we can only expect even bigger, more polluting wildfires in future decades.
With the significance of previous wildfires evident, and the possibility of larger more impactful ones in the imminent future, research into the effect these wildfires are having on the regional climate is imperative. This is why I joined Dr Matt Kasoar on a project investigating the subject using the UK Earth System Model (UKESM1) developed by NERC and the Met Office. From six 200 year climatology simulations, identical but for the initial conditions, he identified 25 very large El Niño events. From these we created three different ensembles, each comprised of 25 simulations, lasting two years from the January before each large El Niño event. The only difference between the ensembles was the wildfire emissions over Indonesia. The original climatology simulations used a long-term average of regional emissions, whilst a second control ensemble, ‘Control13’, used wildfire emissions from 2013 (which were lower than the long-term average). The final ensemble, ‘Bb97’, used 1997 wildfire emissions – the largest on record. By comparing the difference between runs in each ensemble using a paired t-test, we were able to identify statistically significant and intriguing effects of the wildfires on the regional climate.
During the peak of the exceptionally large wildfire emissions in the Bb97 runs, in September and October, the increased black carbon (BC) and organic matter (OM) aerosol from the fires caused significantly more atmospheric absorption of incoming solar radiation than in the control runs, as shown in figure 1. This in turn caused atmospheric heating, alongside surface cooling and accompanying air pressure changes. The result of the temperature and pressure changes was a substantial increase in humidity throughout the whole troposphere regionally, as shown in figure 2. Whilst this linear response could easily be predicted, we also noticed a significant and not straightforward increase in precipitation over the region in the bb97 as opposed to the control13 runs. This was particularly interesting because it reflected a change in the cloud cover over the region which had shifted westwards in the bb97 runs, as shown in figure 3. This directly opposes the effect of an El Niño, which drags clouds eastwards towards the centre of the southern pacific (inducing drought in Indonesia).
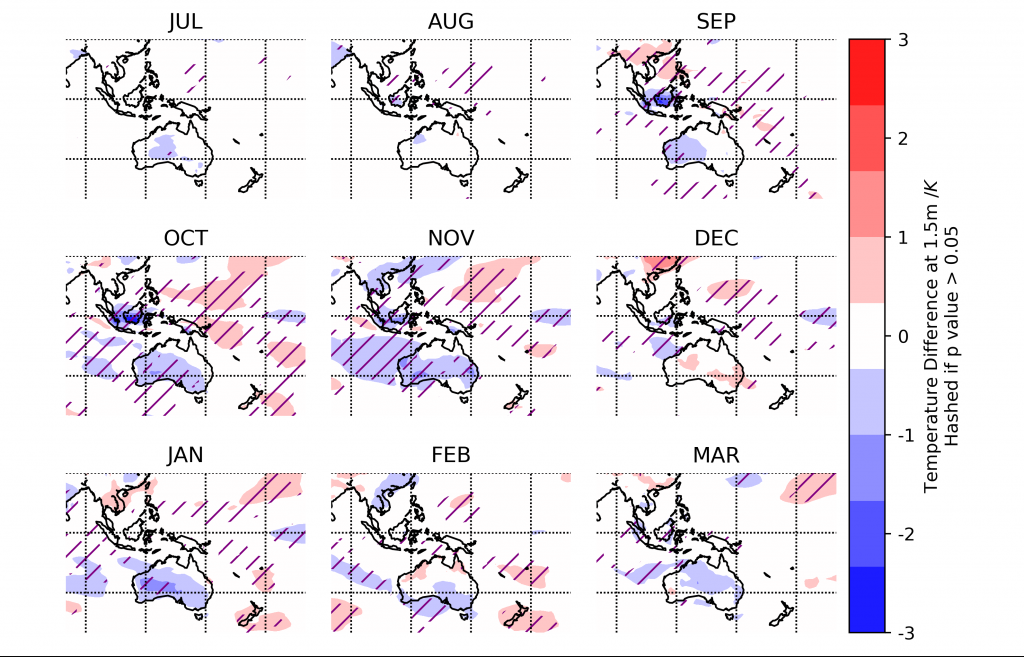
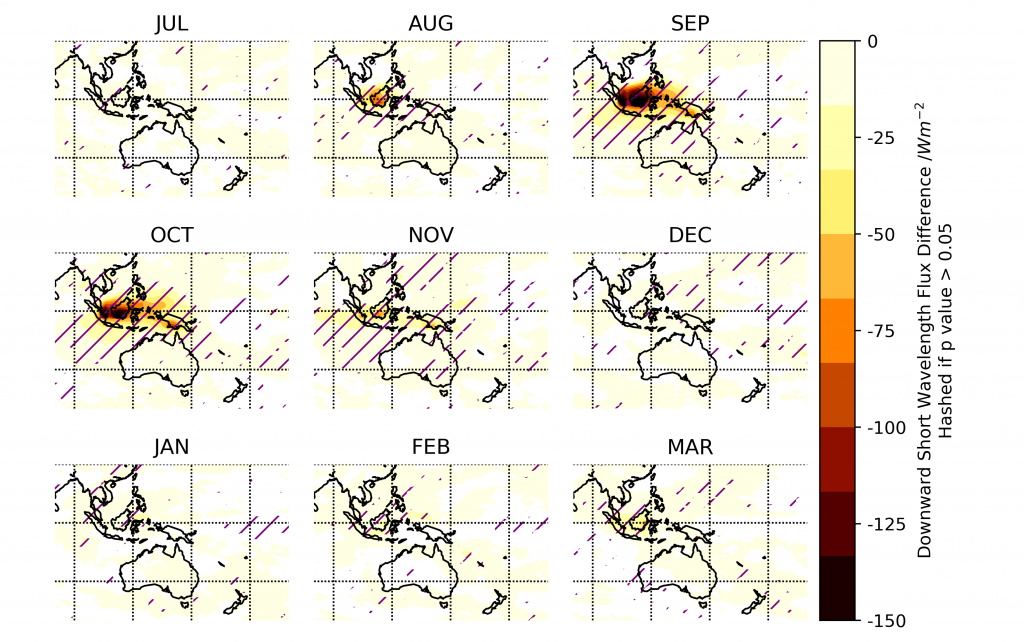
Figure 1: The mean difference between the short-wave (SW) incoming solar radiation reaching the surface in the Bb97 vs Control13 ensembles. Hatching indicates what is statistically significant. There is a clear net decrease in SW flux in the Bb97 ensemble, because the BC and OM aerosols in the atmosphere above are absorbing it. This results in a cooling of the surface locally, as seen in the analogous plot for mean temperature difference on the right. Pressure and humidity changes also follow suit.
The increased precipitation caused by the wildfire emissions therefore had the potential to seriously impact the El Niño weather patterns. We decided to investigate this possibility further, by isolating the data from runs which consistently produced an El Niño event in both the bb97 and Control13 ensembles[1]. In doing so we also gained insights into the natural variability displayed by climate models. We had to check carefully that our results, based on averaging over several simulations, were not hiding large variations in the data, or possibly bimodal distributions. Fortunately this was not the case, and our overall trends were robust – especially when only runs with El Niño events were included in the analysis, as shown in figure 4.
We used two indicators to determine whether a simulation had produced an El Niño event or not: the 6 month average of the sea surface temperature anomalies (SSTAs), and the Oceanic Niño Index (ONI). From these, we identified 9 simulations that had the fingerprint of a typical large El Niño in both the Bb97 and Control13 ensembles. We used these to re-analyse the data and found our previous results became more statistically significant. This not only gave us greater confidence in those findings, but also provided further motivation to look at the effect the wildfire emissions have on the El Niño evolution itself.
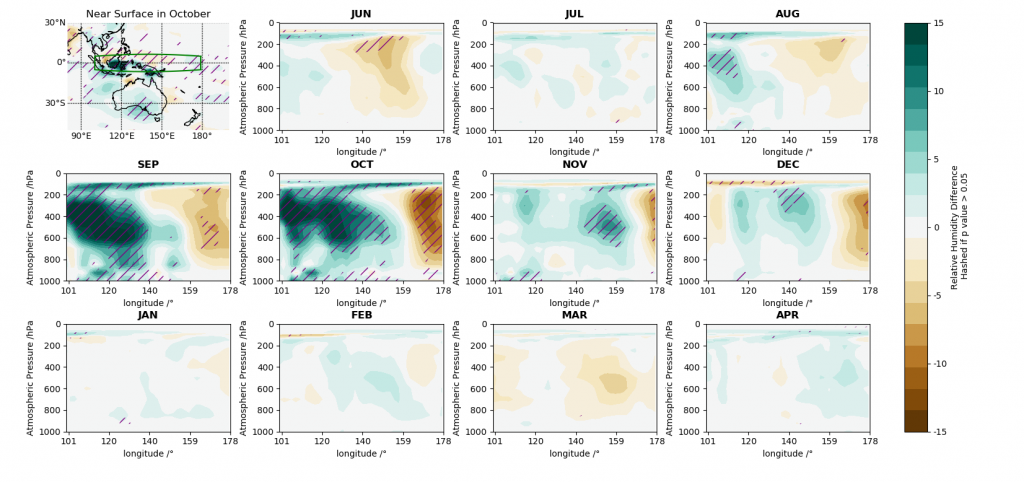
Figure 2: The mean difference between the relative humidity in the Bb97 vs Control13 ensemble averaged over the latitudes shown by the green box on the map. Hatching indicates what is statistically significant. Both relative humidity, shown here, and specific humidity show large increases throughout the troposphere above Indonesia, correlating with the temperature and pressure changes.
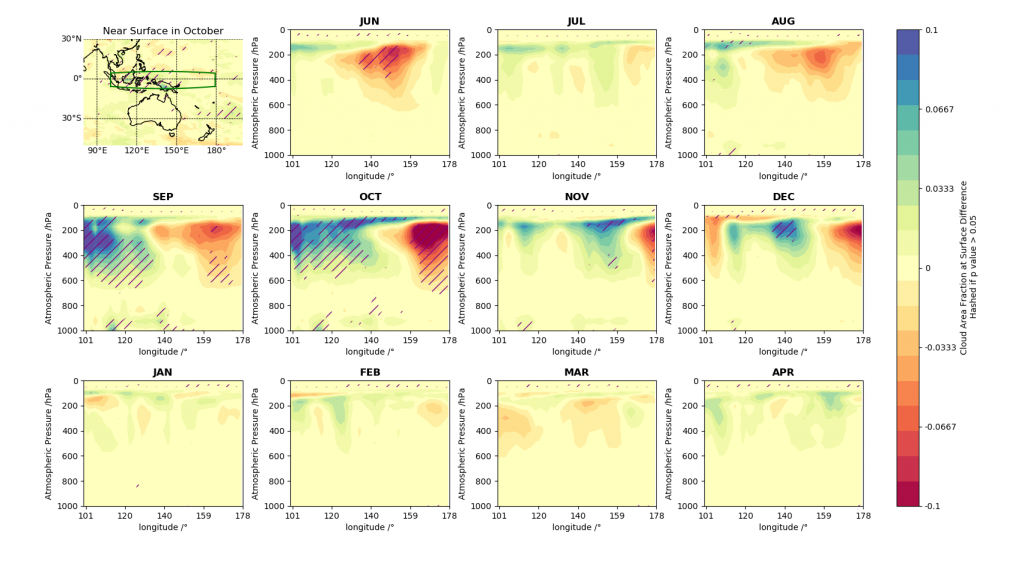
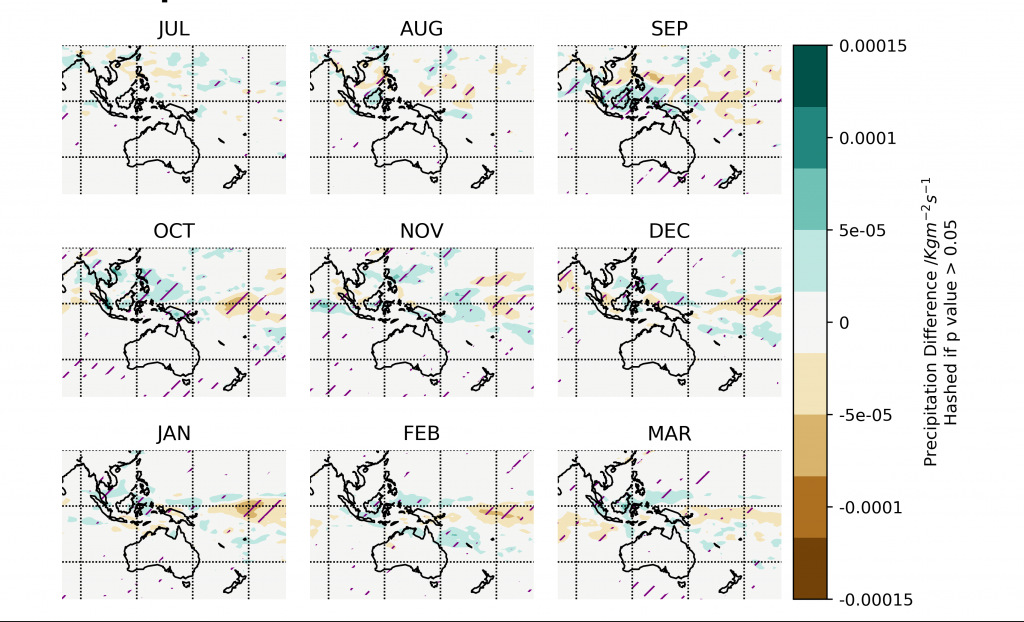
Figure 3 The mean difference between cloud fraction in the Bb97 vs Control13 ensemble averaged over the latitudes shown by the green box on the map. This shows cloud formation dragged eastwards towards Indonesia in the bb97 ensemble relative to the Control13. This trend correlates with the increased precipitation there, shown on the second plot. Hatching indicates what is statistically significant.
To look for the effect of wildfire emissions, we plotted the seasonal evolution of the average ONI and SSTAs of these simulations. We discovered a very clear difference, as shown in figure 5. During the months in which the OM and BC aerosol load in the atmosphere is large, the El Niño is supressed. This is clear from the resulting dent in the ONI peak, and the lower SSTAs across the pacific during the average El Niño event in the Bb97 as opposed to control runs. Our research therefore shows not only that Indonesia’s wildfires have a significant and detectable effect on the regional climate, reducing surface temperatures and increasing humidity and precipitation, but also that the wildfires are impacting the progression of the El Niño itself. This may have wider implications for the climate and weather across the Southern Pacific. Only further research and changes to environmental policy decisions will make this clear in the future.
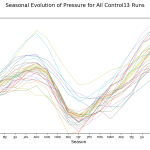
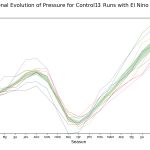
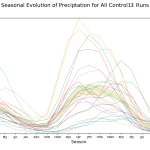
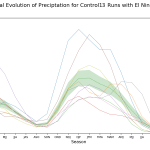
Figure 4 Two examples of the robustness of the trends in the data. (a): The 3 month rolling mean pressure for each run in the Control13 ensemble; (b) the same but for only including runs which had a large El Niño event. Encouragingly, both graphs show the same trend. In fact, the second shows it more strongly and with less variance. The same findings are applicable even for variables that show more natural variability, such as precipitation in the bottom row.
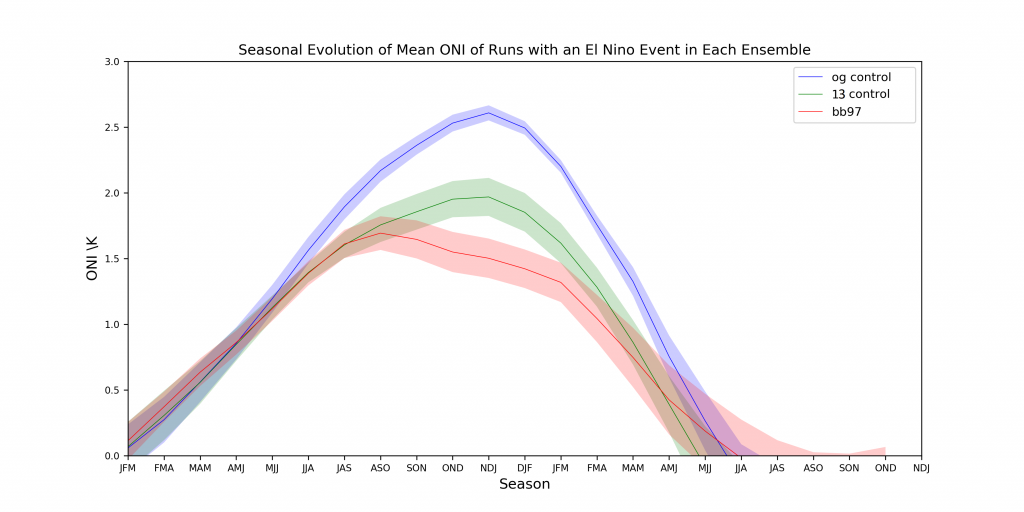
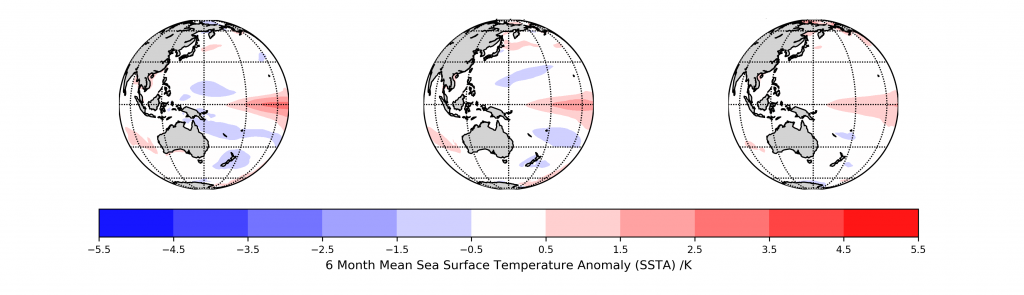
Figure 5 Top: The seasonal evolution of mean ONI of the Bb97 simulations (red) shows a significant dent compared to that for the controls (green and blue). This shows the substantial effect wildfire emissions are having on the El Niño Oscillation. So too do the mean SSTAs shown in the bottom row. The SSTAs for the Bb97 data, right, are degrees cooler across the east pacific compared to both the control runs, shown left and centre.
This work was conducted as part of my summer research placement through Imperial College and the Leverhulme Centre for Wildfires, Environment and Society, who also provided indispensable funding for me. It has been fantastic to learn so much about climate physics and modelling through this placement, and the people at the centre have gone out of their way to make this experience enjoyable and useful for me. I thank them especially for enabling me to participate in the journal clubs and the risk and resilience workshop, both of which I thoroughly enjoyed, not least because they exposed me to areas of research I had never been able to hear about before.
[1] Due to the chaotic nature of the climate, reflected in the UKESM1, although all the runs in the original control ensemble had an El Niño event, the slight changes we made to the initial conditions for the other two ensembles meant not all the Bb97 and Control13 simulations evolved to produce an El Niño event.